The result
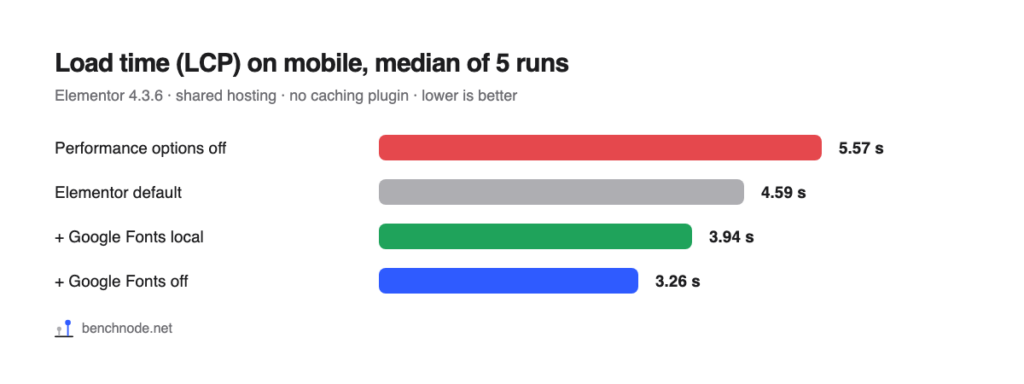
The same Elementor page in seven states, measured five times on mobile and five times on desktop. The table shows the median.
| State | Load time mobile (LCP) | Load time desktop (LCP) | Score mobile | Page weight | Requests |
|---|---|---|---|---|---|
| Performance options off | 5.57 s | 1.34 s | 77 | 922 KB | 73 |
| Elementor default | 4.59 s | 1.19 s | 81 | 708 KB | 67 |
| Default without element caching | 4.70 s | 1.21 s | 81 | 708 KB | 67 |
| + Load Google Fonts Locally | 3.94 s | 0.93 s | 87 | 829 KB | 64 |
| + Optimized CSS Files | 3.93 s | 0.90 s | 88 | 829 KB | 64 |
| + CSS print method “Internal Embedding” | 3.91 s | 0.92 s | 88 | 826 KB | 59 |
| Google Fonts off (system font) | 3.26 s | 0.78 s | 92 | 703 KB | 59 |
Menu, slider, accordion, form and popup worked in every state, with no errors in the browser.
What Elementor already does on its own
These options are on by default in Elementor 4.3. Together they account for one second of load time and 214 KB of page weight in our test:
- Optimized Image Loading (Performance tab): the most important image at the top gets priority, images further down load as you scroll.
- Optimized Gutenberg Loading (Performance): block editor files only load when the page needs them.
- Lazy Load Background Images (Performance): background images except the first load once they scroll into view.
- Inline Font Icons (Features): icons are embedded as small graphics instead of loading the whole Font Awesome font.
- Optimized Markup (Features): Elementor produces leaner HTML.
- Element Cache (Performance, default “1 Day”): Elementor stores rendered elements. On our test page it made no measurable difference, but it doesn’t hurt either.
Important for older sites: if your site was built with an older Elementor version, it may have “Inactive” saved instead of “Default”. Then you don’t get the benefits. Under Elementor → Editor → Settings → Features, check that Inline Font Icons and Optimized Markup are set to “Default” or “Active” and the green dot is on.


The biggest lever: fonts
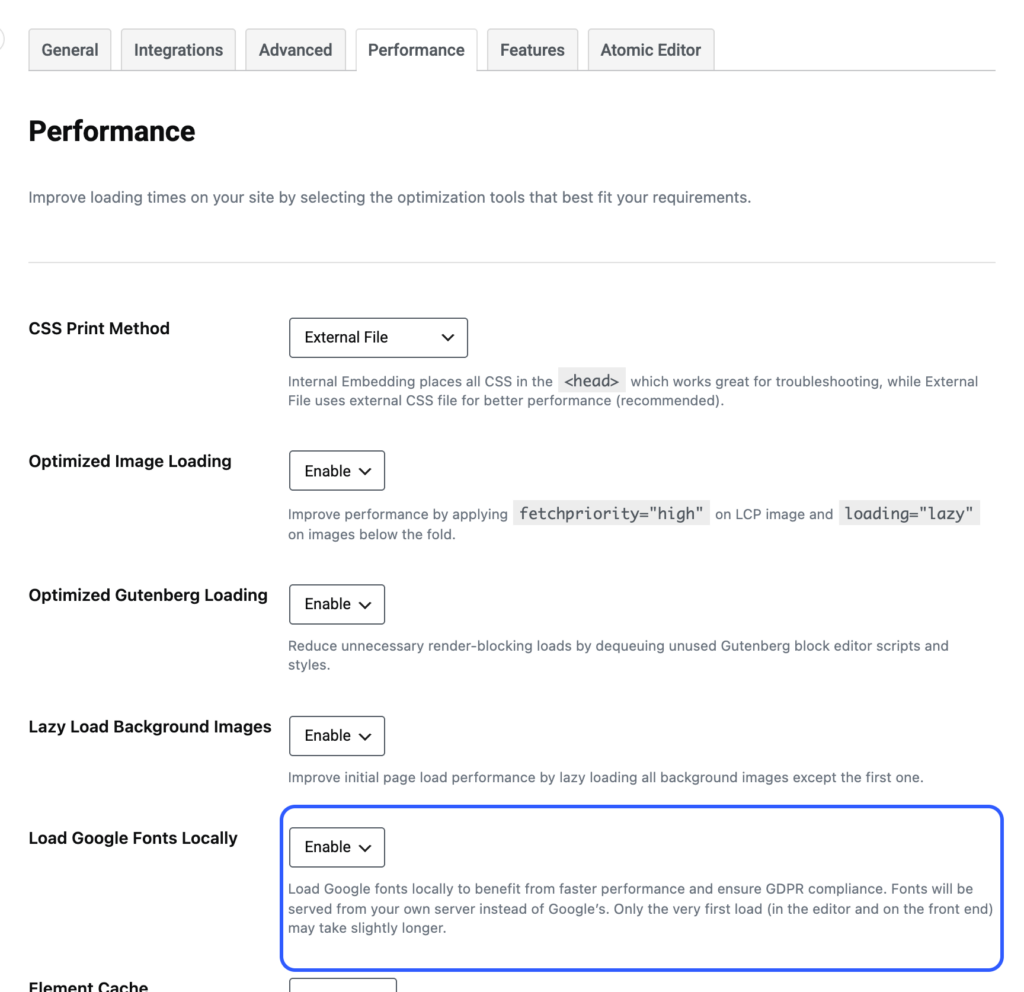
Elementor loads its default fonts (Roboto and Roboto Slab) from Google. Load Google Fonts Locally alone (Performance tab → Enable) cut mobile load time from 4.59 to 3.94 seconds, and no visitor IP goes to Google anymore. How to do it and what happens behind the scenes is in our test Host Google Fonts locally.
It gets even faster without web fonts: with Google Fonts set to Disable (Advanced tab), the page came in at 3.26 seconds. The browser then uses the fonts already on the device.

What didn’t help
- Optimized CSS Files (Features, still alpha): 3.93 instead of 3.94 seconds, well within normal variation. Our advice: leave it off until it’s finished.
- CSS Print Method “Internal Embedding” (Performance): five fewer requests, but no faster load. With “External File” the browser can reuse the CSS on other pages, so “External File” remains the better choice.
- Element Cache off: 4.70 instead of 4.59 seconds, also within variation. Server response time stayed the same. Just leave the default.

What Elementor can’t fix
In every state the server needed 0.6 to 0.8 seconds for its first response. That’s the time WordPress spends building the page on every visit, and no Elementor setting changes it. For that you need a page cache, which we test next with WP Rocket.
Checklist
- Performance: Optimized Image Loading, Optimized Gutenberg Loading and Lazy Load Background Images set to Enable
- Performance: Load Google Fonts Locally set to Enable (or disable Google Fonts entirely under Advanced)
- Performance: CSS Print Method set to External File, Element Cache on default
- Features: Inline Font Icons and Optimized Markup active (green dot), Optimized CSS Files off
- Then clear the Elementor cache under Tools (Clear Files & Data)
For the technically curious: setup and raw data
- Lab: WordPress 7.1.4, PHP 8.4, Hello Elementor 3.5, Elementor 4.3.6, Elementor Pro 4.3.2, shared hosting at All-Inkl, no caching plugin. Reference page with hero image, icon boxes, testimonial slider, gallery, accordion, form and popup. Methodology
- Measurement: Lighthouse 13.5.0, 5 runs each on throttled mobile and desktop after one warm-up request, lab reset to the same snapshot before each state, Elementor CSS regenerated afterwards.
- States: “Performance options off” =
e_font_icon_svgande_optimized_markupinactive,optimized_image_loading,optimized_gutenberg_loadingandlazy_load_background_imagesoff (element caching stayed on). “Google Fonts off” =google_fontoff, pluse_optimized_css_filesactive, which on its own changed nothing measurable. “Without element caching” =element_cache_ttlset todisable. - Functional test in every state with an automated browser: burger menu opens, slider has started, second accordion item opens, form present, popup opens, no console errors. All passed.
- Outgoing connections (recorded with Connection Monitor): with “Load Google Fonts Locally” the server fetches 25 font files from Google once, over 227 requests. Afterwards visitors’ browsers made no requests to outside servers.
- Transparency: we discarded a first measurement series because other work was running on the same server at the time and the functional test hadn’t started. All numbers above come from the repeat run without parallel load. The discarded data is kept in our archive.
- Raw data: messdaten.csv with all 70 runs. Measured on November 7, 2026.