The result
We activated the 50 most popular plugins from the WordPress directory on the same Elementor page: first 10, then 25, then all 50. We measured how long the server needs to build the page, once for the home page (visitors) and once for the dashboard (logged in). On top of that we ran Lighthouse on mobile and desktop.
| Active plugins | Server time home page | Server time dashboard | Queries home page | Memory | Tables |
|---|---|---|---|---|---|
| 0 (base setup) | 237 ms | 230 ms | 144 | 80 MB | 22 |
| 10 | 692 ms | 780 ms | 219 | 194 MB | 68 |
| 25 | 779 ms | 1,043 ms | 279 | 262 MB | 70 |
| 50 | 1,048 ms | 1,299 ms | 341 | 318 MB | 100 |
| 0 (control at the end) | 281 ms | 268 ms | 144 | 80 MB | 22 |
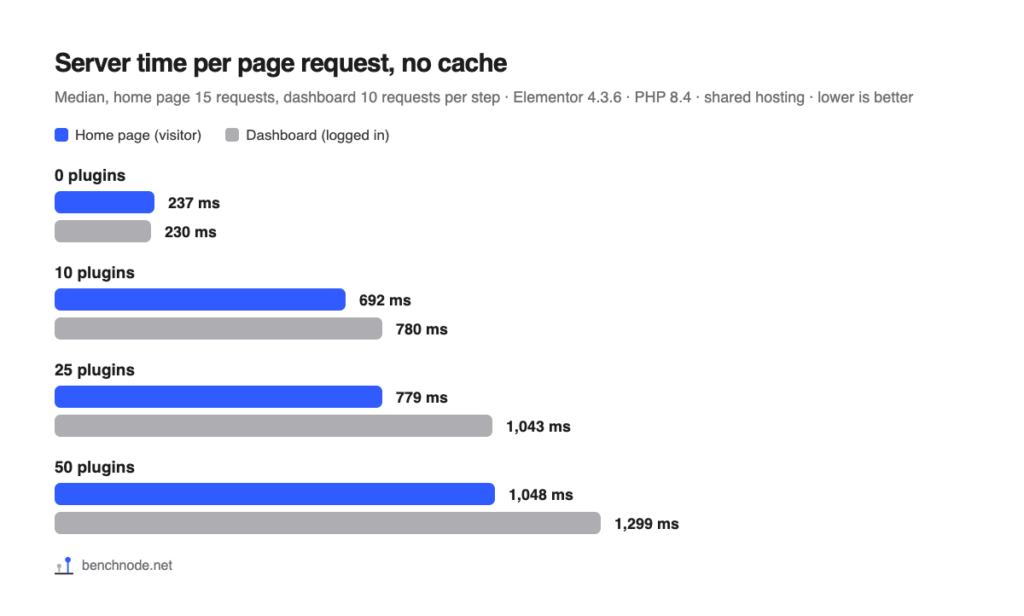
One thing stands out: the first 10 plugins cost more than the next 15 together. That has nothing to do with the number 10, it is about what is in there. The first ten include WooCommerce, Yoast SEO, WPForms and Site Kit, four of the heaviest plugins in the whole test.
Visitors felt less of this than the server time suggests. In Lighthouse mobile, the wait for the first byte went from 0.66 to 1.35 seconds and the Speed Index from 2.5 to 4.3 seconds. The time until the largest element was visible (LCP) only went from 4.54 to 4.83 seconds. The page got 166 KB heavier and needed 46 more requests, because some plugins load their own scripts and styles even on pages that do not use them. Menu, slider, accordion, form and popup worked at every step.
Number versus weight
To settle the question properly, we ran a separate series measuring three variants back to back: the base setup, the base setup plus only WooCommerce, and the base setup plus the 25 plugins ranked 26 to 50.
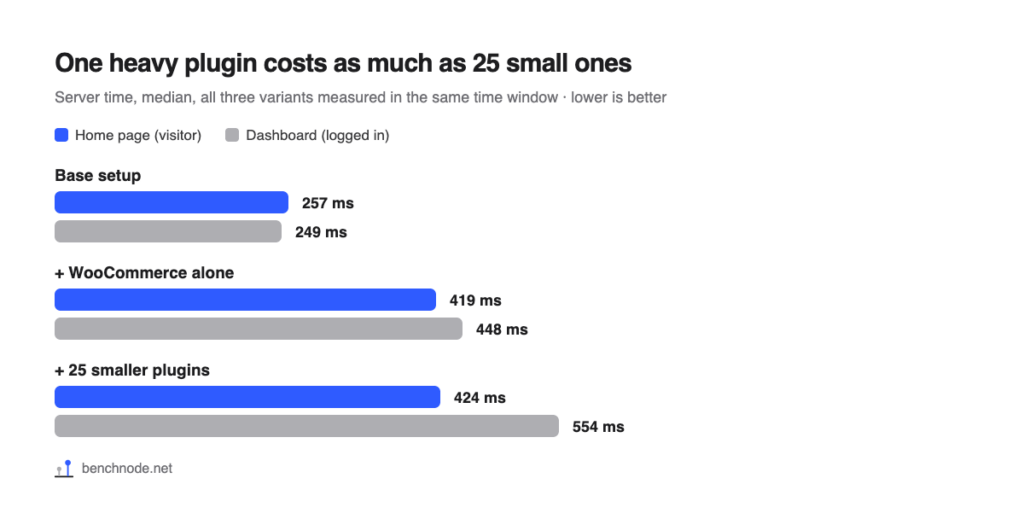
On the home page it was practically a tie: 419 ms with WooCommerce alone, 424 ms with 25 other plugins. Memory was almost the same too (124 vs. 126 MB). So one big plugin can cost as much as two dozen small ones.
In the dashboard the 25 plugins came out ahead (554 vs. 448 ms). The number matters more there, because almost every plugin hooks into the admin with its own menu items, notices and checks.
The heaviest plugins
Next we activated each of the 50 plugins on its own and measured it 20 times. After every five plugins we measured the base setup again, so that server fluctuations would not show up as plugin costs.
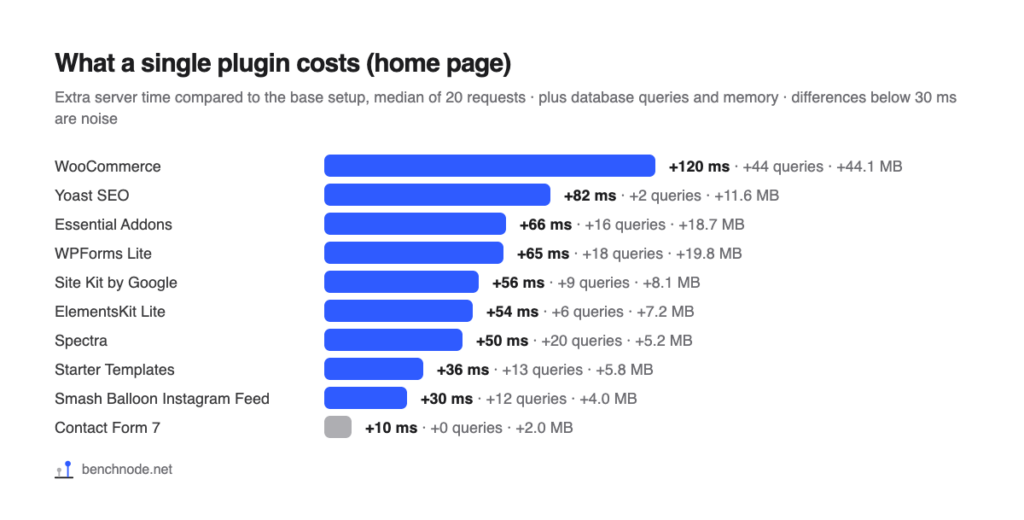
| Plugin | Home page | Dashboard | Queries (home / dashboard) | Memory |
|---|---|---|---|---|
| WooCommerce | +120 ms | +198 ms | +44 / +90 | +44 MB |
| Yoast SEO | +82 ms | +105 ms | +2 / +2 | +12 MB |
| Essential Addons for Elementor | +66 ms | +33 ms | +16 / +11 | +19 MB |
| WPForms Lite | +65 ms | +90 ms | +18 / +54 | +20 MB |
| Site Kit by Google | +56 ms | +49 ms | +9 / +11 | +8 MB |
| ElementsKit Lite | +54 ms | +39 ms | +6 / +5 | +7 MB |
| Spectra | +50 ms | +65 ms | +20 / +33 | +5 MB |
| Starter Templates | +36 ms | +51 ms | +13 / +36 | +6 MB |
| Smash Balloon Instagram Feed | +30 ms | +50 ms | +12 / +31 | +4 MB |
What the heavy plugins have in common: they ship a lot of code and load it on every request, whether the page needs it or not. WooCommerce loads the whole shop even on a page without products. The addon packs for Elementor and Gutenberg register dozens of widgets. Yoast barely touches the database but needs 12 MB of memory for its code.
At the other end, 25 of the 50 plugins cost less than 10 ms each. That is less than the server varies from one measurement to the next anyway. Among them: Classic Editor, Duplicate Page, Regenerate Thumbnails, Better Search Replace, Safe SVG, Flamingo, UpdraftPlus and Mailchimp for WP.
And the costs add up quite honestly: measured one by one, the 50 plugins came to 886 ms in total; all active together, about 800 ms. There is no mysterious tipping point at plugin number X. Each plugin brings its own share, and those shares are very different.
Why the WordPress admin gets slow
If your WordPress admin is slow, plugins are often the reason. In the dashboard, server time went from 230 to 1,299 ms with 50 plugins, and the number of database queries from 132 to 546. There is no page cache for the admin to soften this. Every click is built from scratch.
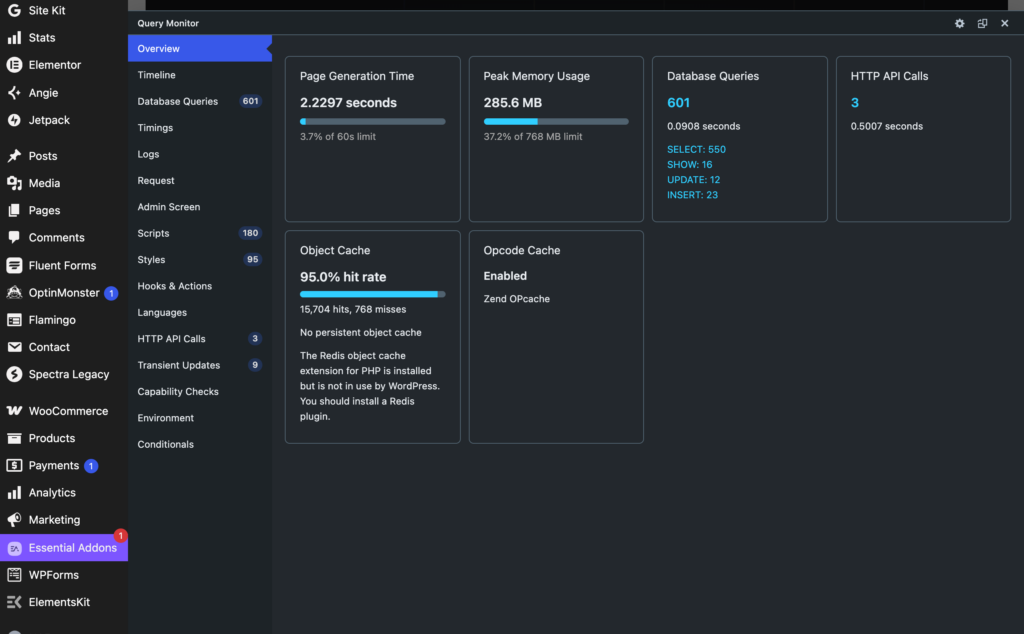
On top of that come outgoing connections. Many plugins check in with their vendor from the admin for news, licenses or offers. With all 50 plugins, Query Monitor showed three such requests on the first dashboard load, taking 0.46 seconds together. The page waits during that time. On the next loads they were gone, because the plugins cache the answer for a while. Then they come back.
With our Connection Monitor we logged who talks to whom. New compared to the base setup were, among others, WooCommerce (woocommerce.com, public-api.wordpress.com), WPForms (wpformsapi.com), Jetpack, MonsterInsights, Duplicator, OptinMonster and XML Sitemaps, which submitted the site to IndexNow. The most striking one was Starter Templates: right after activation, on the first visit to the admin, it fetched data from websitedemos.net 80 times within six seconds, 6.8 MB in total. That is its template library. If you no longer need the plugin after setting up your site, deactivate it.
How to find the slow plugins on your site
The free Query Monitor plugin shows you, for every page load, how long it took and which plugin ran how many database queries. Here is how:
- Install Query Monitor via Plugins → Add New Plugin (search for “Query Monitor”) and activate it.
- Open your home page while logged in. The admin bar now shows four numbers: time, memory, database time and number of queries.
- Click those numbers. The Query Monitor panel opens at the bottom with the Overview.
- Click Database Queries → Queries by Component. This shows how many queries each plugin runs.
- Do the same in the dashboard and check HTTP API Calls to see which plugins call out while the page loads.
- Load every page five times and note the middle value. Single loads vary a lot.
- When you are done, deactivate Query Monitor again. It costs a little time itself.
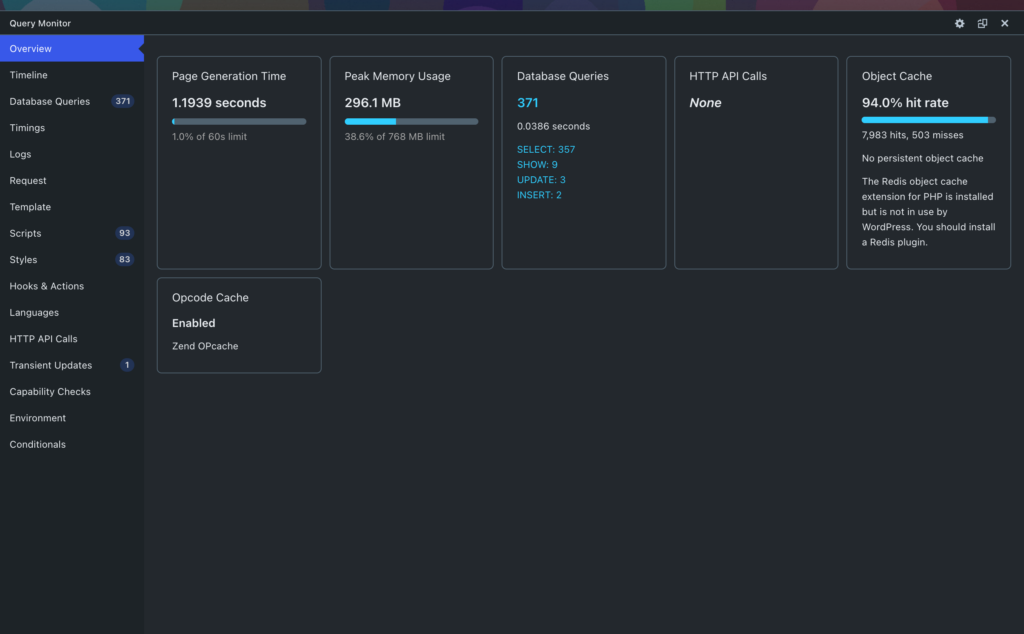
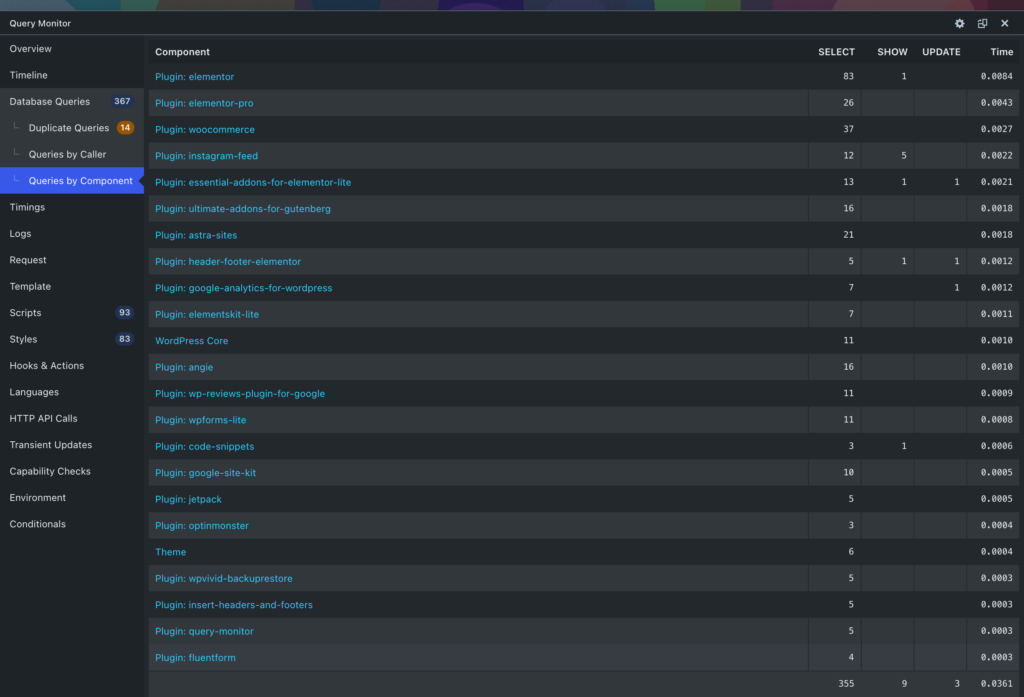
Look at the time in both screenshots as well: the database queries took only 0.04 to 0.07 seconds out of more than a second. Most of the time does not go into the database but into loading and running plugin code. That is why the number of queries is a hint, not the whole story.
The most reliable way to find out whether a specific plugin slows you down: deactivate it, load the page five times again and compare the Page Generation Time.
What you can do
- Delete unused plugins. Inactive plugins load no code. In our test, all 50 were installed but inactive at the starting point, and the page came in at 237 ms. You should still delete them, because inactive code can have security holes too.
- Check the heavy plugins. Do you really need WooCommerce, a big addon pack or a form plugin on this site? One heavy plugin fewer does more than ten small ones fewer.
- Deactivate setup helpers once you are done. Starter Templates, importers and demo importers are needed once. After that they only cost time and outgoing connections.
- Use a page cache for visitors. A cache serves the finished page without running all plugins again every time. We show how to do that with Elementor in WP Rocket settings for Elementor. The admin does not benefit from it.
- Slim down addon packs. Many packs such as Essential Addons or ElementsKit let you switch off unused widgets in their settings. We did not measure how much that saves here.
So the question “how many plugins is too many?” has no single number as an answer. 30 light plugins can be less of a problem than one heavy one. Look at what your plugins cost, then decide.
For the technically curious: setup and raw data
- Lab: WordPress 7.1.4, PHP 8.4, Hello Elementor 3.5.2, Elementor 4.3.6, Elementor Pro 4.3.2, shared hosting at All-Inkl, no caching plugin. Base setup with 4 active plugins: Elementor, Elementor Pro, Angie (Elementor’s AI assistant) and our Connection Monitor. Reference page with hero image, icon boxes, testimonial slider, gallery, accordion, form and popup. Methodology
- Plugin list: the 50 most popular plugins in the WordPress.org directory (“popular” query of November 7, 2026), each in its current version. All 50 were installed and inactive beforehand and were activated in list order.
- Server time: measured with our own probe (a must-use plugin) that writes the time from PHP start to the end of the page, the database queries and memory into the page. Home page logged out, dashboard logged in as administrator, always bypassing any cache. Before every measurement three warm-up requests and three WP-Cron runs, so that plugin setup work is not measured.
- Steps: 0, 10, 25, 50 and finally 0 again as a control, 15 home page and 10 dashboard requests each, plus Lighthouse 13.5.0 with 5 runs each on mobile and desktop. Before every step the lab was reset to the same snapshot.
- One by one: each plugin alone on the base setup, 20 home page and 6 dashboard requests. After every 5 plugins a new measurement of the base setup. The 11 baseline measurements ranged from 235 to 275 ms on the home page (median 252 ms), so differences below about 30 ms cannot be told apart from noise. Antispam Bee once showed +65 ms with no extra queries, files or memory, and +4 ms on the repeat run. We treat that as an outlier. Dashboard values are based on only 6 requests and vary more.
- Drift: the control measurement at the end was 44 ms (home page) and 38 ms (dashboard) above the first. The differences between the steps are 10 to 25 times larger.
- Lighthouse: the time to first byte in Lighthouse includes the trip over the internet and is therefore higher than pure server time. At 10 and 25 plugins it came out in reverse order (1.31 and 1.23 s), which is connection noise. Total Blocking Time was 0 at every step.
- Function test at every step with an automated browser: burger menu, slider, accordion, form and popup. All passed, no console errors.
- Quirk: Widgets for Google Reviews (Trustindex) redirects the first request after activation to its settings page. Our self-test therefore checks twice.
- Transparency: we discarded the first complete run from November 7. Our reset tool had not deleted all database tables, so table count and database size were wrong. Timing values were similar (50 plugins: 969 instead of 1,048 ms). All values above come from the repeat run on November 8 with the fixed tool.
- Raw data: rohdaten.csv with all 2,682 measurements (steps, one by one, fine series, WooCommerce versus 25 plugins). Measured on November 7 and 8, 2026.